Manage data
Your robot’s sensors, cameras, and other components produce data you need to record, analyze, and act on. Viam’s data management service lets you configure which components to capture from, sync captured data to the cloud, and query, export, or use it for ML training without building a custom data pipeline.
How data flows
Data moves through four stages, from your robot to actionable insights:
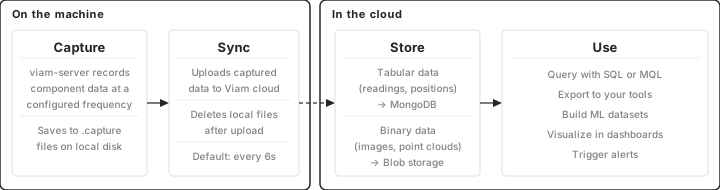
- Capture on the machine. You configure which components to record from and at what frequency. Captured data is written to local disk. Nothing is captured until you configure it.
- Sync to the cloud. A separate process uploads captured data to Viam’s cloud at a configurable interval, then deletes local files. If the machine goes offline, data buffers locally and syncs when connectivity returns.
- Store. In the cloud, tabular data (sensor readings, motor positions, encoder ticks) is stored in MongoDB. Binary data (images, point clouds, audio) is stored in blob storage. Both are indexed and queryable.
- Use. From the cloud, you can query data with SQL or MQL, export it to your own database, build datasets for ML training, create monitoring dashboards, or trigger alerts when data meets a condition.
Capture and sync run independently: you can capture without syncing, or sync files from other sources without using Viam’s capture.
To get started recording data, see Capture and sync data.
Query and explore
All captured tabular data is queryable through SQL and MQL, either in the Viam app’s query editor or programmatically through the SDK. You can run ad-hoc queries for data exploration, create custom indexes to speed up frequent queries, and save MQL queries for reuse. The Query Assistant (Beta) helps you write SQL and MQL queries from a plain-language description.
Binary data (images, point clouds) is browsable and filterable in the Viam app’s Data tab, with viewers for images, video, and 3D point clouds.
See Query data and Query reference.
Transform and pipeline
Data pipelines run scheduled MQL aggregations on your captured data. Use them to compute hourly averages, detect trends, or reshape data for downstream tools. Pipelines run on a cron schedule with optional backfill for historical data.
A hot data store keeps a rolling window of recent data in a fast-query database, so you can build real-time dashboards without scanning the full archive.
See Create a data pipeline and Hot data store.
Export and integrate
Viam is not a data silo. You can export data to your own tools and databases:
- CLI export: download binary or tabular data in bulk.
- SDK access: query and download data programmatically from Python or Go.
- Direct MongoDB connection: connect Grafana, Tableau, or custom scripts directly to your data through a MongoDB connection URI.
See Export data and Sync to your database.
Delete data
Delete captured data on demand through the Viam app, the CLI, or the SDK, or set retention policies to auto-delete data after a configured number of days.
The SQL and MQL query editor is read-only: you cannot delete data through it.
See Delete data and Platform-managed capture settings.
Annotate and train
Captured images can be tagged, annotated with bounding boxes, and organized into datasets for ML training. Viam provides a complete path from captured data to a deployed model:
- Capture images from your robot’s cameras.
- Label them with tags and bounding boxes in the Viam app.
- Organize labeled images into a dataset.
- Submit a training job (Vertex AI AutoML or your own training container).
- Deploy the trained model back to your robot.
See Tag data, Create a dataset, and the training section for details.
Monitor and debug
Triggers send webhooks, email alerts, or push notifications when synced data meets a condition, so you can respond to events like temperature spikes or detection results without polling.
Monitoring dashboards can be built with Viam’s Teleop workspace or with Grafana connected to your data through MongoDB.
OpenTelemetry distributed tracing
Viam includes OpenTelemetry (OTel) tracing that propagates trace context across your SDK code, viam-server, and modules. Traces cover gRPC request lifecycle, data capture operations, and module calls. When tracing is enabled on viam-server, module tracing is activated automatically.
To enable tracing, add a tracing block at the top level of your machine’s JSON config (alongside "components" and "services"). You must set enabled to true and enable at least one export destination (disk, console, or otlpendpoint). Setting only "enabled": true without an export destination has no effect.
Save traces to disk for later retrieval with the CLI:
{
  "tracing": {
    "enabled": true,
    "disk": true
  }
}
This writes traces to $HOME/.viam/trace/<part-id>/traces/ as compressed OTLP protobuf files. Download and import saved traces with the CLI. See Traces for instructions and troubleshooting tips.
Export directly to an OTLP-compatible backend (Jaeger, Grafana Tempo, Datadog, or any OTLP collector):
{
  "tracing": {
    "enabled": true,
    "otlpendpoint": "<collector-host>:4317"
  }
}
For local development, see the Jaeger getting started guide to set up a local instance that accepts OTLP traces.
Print traces to the console for quick debugging without any external tools:
{
  "tracing": {
    "enabled": true,
    "console": true
  }
}
You can combine multiple destinations (for example, "disk": true and "otlpendpoint": "<collector-host>:4317" together).
Trace your module’s methods
When tracing is enabled, each incoming component or service method call in your module opens its own span, nested under the RPC that triggered it.
Reading a camera, for example, produces a GetImage span under the caller’s request span, so you can see how long that method takes as part of the whole request.
The Go, Python, and C++ SDKs all create these per-method spans.
viam-server sets the VIAM_MODULE_TRACING environment variable on each module process when tracing is enabled in the machine config.
The SDK inside the module records spans only when that variable is set.
You enable tracing once in the tracing config block above, and individual modules pick it up.
Go modules record per-method spans automatically. Python and C++ modules each need one more step, described below.
Enable tracing in a Python module
Python module tracing is an opt-in extra.
Install viam-sdk with the tracing extra so the module has the OpenTelemetry packages it needs:
pip install 'viam-sdk[tracing]'
Add this extra to your module’s dependencies (for example, in requirements.txt) so it is present wherever the module runs.
The extra is the only change your module needs.
With the extra installed and tracing enabled in the machine config, each component and service method your module implements emits a span, and the module sends those spans to viam-server.
Without the extra installed, tracing stays off and your module runs unchanged.
Enable tracing in a C++ module
C++ tracing has two requirements: you build the SDK with OpenTelemetry support, and, as with Go and Python, tracing is enabled on viam-server in the machine config.
Compiling with OpenTelemetry support alone records nothing until the module runs under a viam-server that has tracing enabled; a build without OpenTelemetry support compiles the tracing calls as no-ops.
How you enable the build support depends on how you build the SDK:
- With Conan: the
opentelemetry_tracingoption is on by default. It pulls inopentelemetry-cppwith the OTLP gRPC exporter and compiles tracing into the SDK. To build without tracing, set the option off (-o opentelemetry_tracing=False). - With CMake directly: the
VIAMCPPSDK_OPENTELEMETRY_TRACINGoption is off by default. Turn it on with-DVIAMCPPSDK_OPENTELEMETRY_TRACING=ON, and provideopentelemetry-cpp(built with the OTLP gRPC exporter) as a dependency.
Because tracing must be compiled in, prebuilt SDK packages and the cloud build image do not include it. Build the SDK from source with the option above to record spans from a C++ module.
To trace a section of your own code inside a method, create a child span with TracingSpan from <viam/sdk/tracing/span.hpp>.
The span begins when you construct it and ends when it leaves scope, so scope it to the region you want to measure:
#include <viam/sdk/tracing/span.hpp>

ProtoStruct MySensor::get_readings(const ProtoStruct&) {
    TracingSpan span("readings implementation");
    span.set_attribute("multiplier", multiplier_);  // attach structured context
    span.add_event("computing signal");
    // your logic here
    span.set_status_ok();
    return {{"signal", multiplier_}};
}
TracingSpan also provides set_status_error(), record_exception() and record_unknown_exception() to mark a failure, and end() to end the span before it leaves scope.
You cannot copy or move a TracingSpan.
This span nests under the automatic GetReadings span for the call, and the SDK exports it over OTLP gRPC to the destination you set in the tracing config block above.
If the SDK is built without OpenTelemetry support, every TracingSpan call is a no-op and the code runs unchanged.
Use traces to find latency and failures
Because each method span nests under the request that called it, a trace shows where time goes across service boundaries.
If a Move request is slow, expand its trace to see whether the delay is in the arm’s GetJointPositions span, a vision service’s GetDetections span, or the network between them.
A method that returns an error marks its span with an error status, so a failed span points to the method and machine that returned the failure.
Retrieve and inspect traces with the viam traces CLI commands.
See Traces and Work with traces.
See Trigger on data events and Visualize data.
Manage data volume
Robots can generate more data than your network can transfer or your budget can store. Viam provides several tools to control data volume:
- Capture frequency: set per-component, from sub-second to infrequent intervals.
- Conditional sync: a sensor on the machine decides whether to sync or hold data.
- Edge filtering: write a custom sensor module that evaluates data before capture and only records what matters.
- Retention policies: configure how long data is retained in the cloud.
See Filter at the edge and Conditional sync.
Security and data integrity
Data is encrypted in transit using gRPC and encrypted at rest by the cloud storage provider.
The sync process is designed to prevent data loss and duplication:
- If the connection drops, the service retries at exponentially increasing intervals until restored.
- Sync resumes where it left off without duplicating data.
- Files still being written are not synced until they stabilize (configurable, default 10 seconds).
Was this page helpful?
Glad to hear it! If you have any other feedback please let us know:
We're sorry about that. To help us improve, please tell us what we can do better:
Thank you!